Deployment recipe · Monitoring
Prometheus: the numbers, kept long enough to be useful
Uptime Kuma tells you a service is down. Prometheus tells you the service has been leaking memory since March, which is the more useful sentence. It is the heaviest single service on this rack at 760 MB and the one where the retention configuration decides whether it stays under a gigabyte or eats the SSD.
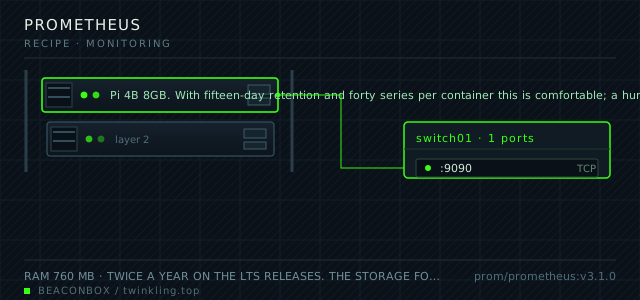
| image | prom/prometheus:v3.1.0 |
|---|---|
| host ports | :9090/tcp |
| volume path | /srv/homelab/prometheus/data |
| RAM | 760 MB |
| CPU share | 0.50 vCPU (cpus: "0.50") |
| update cadence | twice a year on the LTS releases. The storage format is not backward compatible across major versions, so a downgrade means losing the history |
| arm64 | arm64 native; the ingestion path is single-threaded per target and the Pi handles a few hundred series without trouble |
| host | container | proto | exposed | used for |
|---|---|---|---|---|
| :9090 | 9090 | tcp | LAN only | query UI and the target health page, mostly used to check what stopped being scraped |
Deployment steps
Create the config and data directories with the right ownership
Prometheus runs as uid 1000 in the container and will not start with a data directory it cannot write. The config directory can stay root-owned as long as it is readable.
run sudo mkdir -p /srv/homelab/prometheus/{config/rules,data} sudo chown -R 1000:1000 /srv/homelab/prometheus/data sudo chmod -R a+rX /srv/homelab/prometheus/configWrite the scrape configuration with external labels
External labels are what let you tell this Prometheus apart from another one later, and what remote-write targets use to route the data. Set them now even though there is only one instance.
run cat > /srv/homelab/prometheus/config/prometheus.yml <<'EOF' global: scrape_interval: 30s evaluation_interval: 30s external_labels: rack: home tls_config: insecure_skip_verify: false scrape_configs: - job_name: prometheus static_configs: [{targets: ['localhost:9090']}] - job_name: node static_configs: [{targets: ['node-exporter:9100']}] - job_name: cadvisor static_configs: [{targets: ['cadvisor:8080']}] rule_files: - /etc/prometheus/rules/*.yml EOFStart it and check that every target is up
A target that reports DOWN with a context deadline error is a network problem; one that reports DOWN with a 404 is a path problem. Read which one it is before changing configuration.
run cd /srv/homelab/prometheus && docker compose up -d docker logs --tail 30 prometheus # then open http://192.168.10.20:9090/targets and confirm all three are UPAdd the recording rules and verify one by querying it
A recording rule that has never been queried is a rule you do not know works. Run the recorded series name in the query box after a minute.
run docker compose restart prometheus # query: instance:node_cpu:rate5m # the graph should show a line within one evaluation intervalPoint Grafana at it and set the retention limits
The data source was already provisioned in the Grafana configuration; confirm the connection test passes and then watch the disk usage for a week before deciding whether fifteen days is affordable.
run docker exec grafana wget -qO- http://prometheus:9090/-/ready docker exec prometheus du -sh /prometheus
Retention is the setting that matters
Prometheus compresses well — roughly 1.7 bytes per sample — but a rack with forty containers and a hundred and fifty series per container produces around two million samples a day. Fifteen days of that is about 250 MB on disk, and the default retention of fifteen days is set here deliberately rather than left to the default of forever.
A size limit is set as well as a time limit. The time limit is what you want for the graphs; the size limit is the seatbelt for the day a container starts exporting ten times as many series as it used to.
# check actual usage rather than guessing
docker exec prometheus du -sh /prometheus
curl -s localhost:9090/api/v1/status/tsdb | python3 -c 'import json,sys; d=json.load(sys.stdin)["data"]; print(d["headStats"])'
Recording rules turn slow queries into fast ones
Every dashboard panel that runs a rate() over a fifteen-day window is re-computing it on every page load. Recording rules pre-compute those into new series, which is what makes a Raspberry Pi able to serve a dashboard in under a second.
Four recording rules cover all three dashboards here: CPU rate per instance over five minutes, memory used as a fraction, container memory over five minutes, and disk usage fraction. Everything else is queried ad hoc.
# /srv/homelab/prometheus/config/rules/recording.yml
groups:
  - name: rack-recording
    interval: 30s
    rules:
      - record: instance:node_cpu:rate5m
        expr: 1 - avg by (instance) (rate(node_cpu_seconds_total{mode="idle"}[5m]))
      - record: instance:node_memory:used_fraction
        expr: 1 - node_memory_MemAvailable_bytes / node_memory_MemTotal_bytes
      - record: container:memory:rate5m
        expr: sum by (name) (rate(container_memory_working_set_bytes[5m]))
What to alert on, and what to leave alone
Three alert rules, and they are all slow burns rather than instantaneous thresholds. Disk more than eighty percent full for two hours. Predicted disk-full within seven days, computed from the linear trend over six hours. A container that has restarted more than five times in an hour.
What is deliberately not alerted: CPU spikes, temperature above seventy, a service that is briefly unreachable. These produce notifications that train people to ignore notifications. The temperature one is a dashboard panel and a person, not a rule and a phone.
# /srv/homelab/prometheus/config/rules/alerts.yml
groups:
  - name: rack-alerts
    rules:
      - alert: DiskFillingUp
        expr: predict_linear(node_filesystem_avail_bytes{mountpoint="/"}[6h], 7*86400) < 0
        for: 2h
      - alert: ContainerRestartLoop
        expr: increase(container_start_time_seconds[1h]) > 5
        for: 10m
The exporters, and which one to be careful with
The node exporter runs with pid: host and the root filesystem mounted read-only at /host, which is what gives the host metrics including the thermal zones. It is the standard pattern and it is a broad read of the host filesystem, which is the trade for host metrics on a container platform.
cAdvisor is the one to watch: it runs privileged and reads the Docker socket directory to enumerate containers, which is effectively read access to everything the daemon knows. It is bound to the LAN interface and never published beyond it.
compose file
Drop the whole file at /srv/homelab/prometheus/compose.yaml. Tags are pinned, never latest: rolling back on a Pi is far more work than upgrading.
services:
  prometheus:
    image: prom/prometheus:v3.1.0
    container_name: prometheus
    restart: unless-stopped
    ports:
      - "9090:9090/tcp"
    command:
      - --config.file=/etc/prometheus/prometheus.yml
      - --storage.tsdb.path=/prometheus
      - --storage.tsdb.retention.time=15d
      - --storage.tsdb.retention.size=4GB
      - --web.enable-lifecycle=false
      - --web.enable-admin-api=false
      - --web.listen-address=0.0.0.0:9090
    volumes:
      - /srv/homelab/prometheus/config:/etc/prometheus
      - /srv/homelab/prometheus/data:/prometheus
    user: "1000:1000"
    networks: [rack]

  node-exporter:
    image: prom/node-exporter:v1.8.2
    container_name: node-exporter
    restart: unless-stopped
    pid: host
    volumes:
      - /:/host:ro,rslave
    command:
      - --path.rootfs=/host
      - --collector.thermal_zone
      - --collector.hwmon
    networks: [rack]

  cadvisor:
    image: gcr.io/cadvisor/cadvisor:v0.50.0
    container_name: cadvisor
    restart: unless-stopped
    privileged: true
    devices:
      - /dev/kmsg
    volumes:
      - /:/rootfs:ro
      - /var/run:/var/run:ro
      - /sys:/sys:ro
      - /var/lib/docker/:/var/lib/docker:ro
    networks: [rack]

networks:
  rack:
    external: true
Hardening checklist
- the query UI is on the LAN only; it can execute arbitrary queries against every metric on the rack and has no place on the internet
- the admin API and the lifecycle endpoints are disabled, so no HTTP call can delete a time series or trigger a reload from outside
- scrape targets use a read-only credential where the exporter supports one, and exporters are bound to the LAN interface rather than 0.0.0.0
- container metrics come from cAdvisor bound to the LAN; it is the exporter with the largest attack surface on the rack
Backup plan
the time series database is treated as disposable: losing it loses the graphs, not the ability to collect. Configuration, alert rules and the recording rules are the durable part and live in git. The one thing worth copying is the alert state file, and even that is a convenience rather than data.
Verify it went in clean
- The targets page shows every job as UP and the scrape duration well under the thirty-second interval
- A recording rule series returns data when queried by name
- Disk usage after a week is under 300 MB, which means the retention settings are behaving
- Stopping a container produces a visible gap in the container memory panel within two scrape intervals
What bit us
- The storage format is not backward compatible across major versions. Once this runs for a month, downgrading means deleting the data directory. Pin the version and read the release notes before a major bump.
- A scrape interval of 15s doubles the series count and the disk usage compared to 30s, and for a household rack the extra resolution buys nothing. Leave it at 30s.
- cAdvisor with the Docker socket readable sees environment variables of every container, including the passwords in the compose files. It stays on the LAN and behind no proxy rule at all.
- Recording rules that are never queried still consume CPU on every evaluation. Every rule on this rack exists because a dashboard panel uses it; there is no speculative rule writing here.
Hardware questions
- Prometheus or VictoriaMetrics or InfluxDB?
- Prometheus if the ecosystem's exporters and Grafana dashboards matter more than long retention. VictoriaMetrics if you want years of retention on the same hardware — it compresses better and queries faster, and it accepts Prometheus scrape configuration. For a household rack with fifteen days of retention, the difference is not worth a migration.
- How many targets can a Pi handle?
- A Pi 4 handles a few hundred thousand active series, which at forty containers with a hundred and fifty series each is around six thousand — two orders of magnitude of headroom. The limit you will hit first is the SSD's write endurance, not the CPU.
- Do I need this if Grafana and Uptime Kuma are already running?
- If you only want to know whether a service is up, no. If you want to know whether the memory usage is trending upward, then yes, and there is no other way to answer that question on this rack — Uptime Kuma does not store metrics and Grafana has nothing to draw without a data source.