Deployment recipe · Monitoring
Monitoring the rack with Uptime Kuma, without monitoring yourself to death
Uptime Kuma is the smallest useful service on this rack: 180 MB of RAM, an SQLite file, and a dashboard that answers one question — is the thing up. The trap is not the software, it is the monitor list. Twenty monitors that all fire at once when you reboot the router will teach you to ignore the notifications, and a notification you ignore is worse than no notification at all.
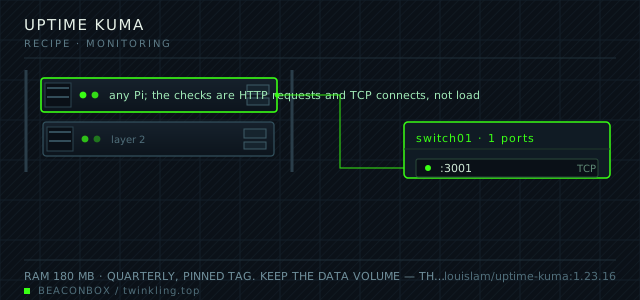
| image | louislam/uptime-kuma:1.23.16 |
|---|---|
| host ports | :3001/tcp |
| volume path | /srv/homelab/uptime-kuma/data |
| RAM | 180 MB |
| CPU share | 0.25 vCPU (cpus: "0.25") |
| update cadence | quarterly, pinned tag. Keep the data volume — the SQLite schema migrates automatically and there is no downgrade path |
| arm64 | arm64 native; the image ships a bundled Chromium for the screenshot monitor, which is what makes it 400 MB on disk |
| host | container | proto | exposed | used for |
|---|---|---|---|---|
| :3001 | 3001 | tcp | LAN only | dashboard, monitors and the status page you can share |
Deployment steps
Create the data directory before the first start
The official image expects /app/data to be writable. Letting Docker create it gives you a container that starts and then fails to create its database.
run sudo mkdir -p /srv/homelab/uptime-kuma/data sudo chown -R 1000:1000 /srv/homelab/uptime-kumaStart it and create the single admin account
There is no default password and no environment variable for one — the first visit creates the account. Do it from the LAN immediately, before the proxy is in front of it.
run cd /srv/homelab/uptime-kuma && docker compose up -d docker logs --tail 20 uptime-kuma # then open http://192.168.10.20:3001 and create the admin userAdd monitors in dependency order
Start with the gateway, then DNS, then the proxy, then the services behind it. When something is down, the list then reads top-down as a diagnosis instead of a wall of red.
run # Dashboard -> Add New Monitor, use the types and intervals from the table aboveWire one notification channel and prove it works
Add the channel, then use the Test button. A notification channel that has never fired is a notification channel that does not work, and you find that out at the worst moment.
run # Settings -> Notifications -> Setup Notification -> Test # then stop a container on purpose and wait out the retry windowPut a status page behind basic auth at the proxy
The status page is fine to share with the household; the dashboard is not. Terminate the auth at Caddy so the credentials never reach the container.
run docker exec caddy caddy hash-password --plaintext "$(openssl rand -base64 12)" # paste the hash into the basicauth block for the /dashboard path
Nine monitors, each with a reason
The rule here is that every monitor must correspond to something a person in the house would notice. That gives nine entries: six services that the household touches daily, two network facts (the gateway answers, the WAN resolves a name), and one certificate expiry check.
Everything else — CPU, disk, memory — belongs in a metrics stack, not in a service that pages you. Uptime Kuma is very good at binary up-or-down and not the right tool for anything with a number in the answer.
| monitor | type | interval | what it means if it fails |
|---|---|---|---|
| dns | TCP 192.168.10.20:53 | 60s | the house cannot resolve anything |
| proxy | HTTP head on the rack hostname | 60s | every web service is down at once |
| jellyfin | HTTP keyword 'Jellyfin' | 120s | media is down, nobody dies |
| immich | HTTP 200 on /api/server/ping | 120s | photo backup on phones stops |
| nextcloud | HTTP 200 on /status.php | 180s | file sync stops |
| gateway | ping 192.168.10.1 | 60s | the network itself is broken |
| wan dns | DNS query for a public name | 300s | upstream is broken, LAN is fine |
| cert rack | TLS expiry under 14 days | 1/day | the padlock is about to go |
| nas | TCP 192.168.10.5:445 | 180s | backups are writing into the void |
Why 60 seconds and not 30
A one-minute interval on nine monitors is about 13,000 checks a day, which the Pi spends no measurable time on. Thirty seconds buys nothing except a longer recovery tail: when the router reboots, the faster poll just produces more failure notifications for the same outage.
Retries matter more than the interval. Three retries before alerting turns a five-second hiccup during a container restart into silence, which is what you want.
Notification routing that survives a reboot
The single most useful thing this service does is tell you that the thing you just did broke something. That only works if notifications survive the reboot: the whole stack comes back in a different order every time, and a monitor that fires during boot is noise.
Two settings fix it. Notification delay of 120 seconds, so a service that is up by the time the timer expires never alerts; and a maintenance window scheduled around your own update window, so planned restarts are silent by construction.
# set a maintenance window once a week at 04:00 for two hours
# Dashboard -> Maintenance -> Add: cron 0 4 * * 0, duration 120m, apply to all monitors
The backup you can actually test
This is the one service where the backup is trivially testable, which makes it worth doing properly: stop nothing, run the SQLite backup command, open the copy with sqlite3 and count the monitors. If the count is right, the backup is good.
Restoring is a file copy and a restart. Ten minutes of work, and it is the drill that proves your other backups are worth running.
docker exec uptime-kuma sqlite3 /app/data/kuma.db ".backup '/app/data/kuma-backup.db'"
docker cp uptime-kuma:/app/data/kuma-backup.db /srv/homelab/uptime-kuma/kuma-$(date +%F).db
sqlite3 /srv/homelab/uptime-kuma/kuma-$(date +%F).db "select count(*) from monitor;"
compose file
Drop the whole file at /srv/homelab/uptime-kuma/compose.yaml. Tags are pinned, never latest: rolling back on a Pi is far more work than upgrading.
services:
  uptime-kuma:
    image: louislam/uptime-kuma:1.23.16
    container_name: uptime-kuma
    restart: unless-stopped
    ports:
      - "3001:3001/tcp"
    environment:
      TZ: Asia/Shanghai
      UPTIME_KUMA_DISABLE_STATS: "true"
    volumes:
      - /srv/homelab/uptime-kuma/data:/app/data
    security_opt:
      - no-new-privileges:true
    networks: [rack]

networks:
  rack:
    external: true
Hardening checklist
- the status page is public but the dashboard is behind basic auth at the proxy, with two-factor enabled on the single account
- monitors use a dedicated credential that only has read access where the target supports it
- notification webhooks are stored as environment variables rather than in the database, so a database leak does not hand over the chat channel
- the container runs with no-new-privileges and cannot talk to the Docker socket — it does not need to
Backup plan
the kuma.db SQLite file is dumped nightly with sqlite3 .backup while the container is running, then copied to the NAS. A raw file copy of a live SQLite database can be torn; the .backup command is the safe way and takes under a second at this size.
Verify it went in clean
- Stopping a monitored container produces exactly one notification after the retry window, not one per retry
- The status page loads for a device on the LAN without logging in, and the dashboard does not
- After a full reboot of the Pi, no stale failure notifications arrive during the boot window
- The nightly SQLite backup opens and reports the same monitor count as the live database
What bit us
- Pointing a monitor at a container name instead of the LAN address means the check succeeds from inside the Docker network while the service is unreachable for actual clients. Monitor the way a client reaches it.
- The certificate monitor checks the certificate the proxy serves, so it must point at the public hostname, not at the internal IP. Pointing it inside makes it report 0 days forever.
- Uptime Kuma's default interval of 20 seconds across twenty monitors is what makes people call it noisy. The noise is a configuration choice, not a property of the tool.
- Deleting a monitor removes its history. Export the database before a big cleanup if you care about the uptime percentage on the status page.
Hardware questions
- Uptime Kuma or Prometheus for alerting?
- Both, with different jobs. Uptime Kuma answers 'is it up' in one screen and is worth 180 MB for that alone. Prometheus and Alertmanager answer 'is it getting worse' — disk filling, memory creeping, response times drifting — and are worth their 1.5 GB only once you have more than a handful of services.
- Can the monitoring live on the same Pi it monitors?
- For a home rack, yes — the failure mode it cannot see is the whole Pi dying, and you will notice that without a notification. If you want coverage of that case, the cheap answer is a second-hand Pi Zero 2 W with one monitor pointed at the status page.
- How much disk does the history take?
- About 40 MB per monitor per year at a 60-second interval, because heartbeats are stored as rows and old ones are pruned by the retention setting. Set retention to 180 days and a 32 GB card will never be the thing that kills the container.