Service card · Monitoring
Grafana as the pane of glass over the rack
Grafana on its own does nothing — it is a drawing engine that needs a data source. It earns its 260 MB by being the one place where the numbers from Prometheus, the node exporter and the container metrics end up on the same screen, with a history long enough to answer the only question that matters: is this getting worse?
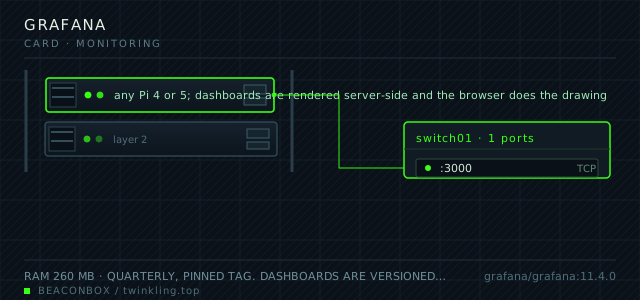
| image | grafana/grafana:11.4.0 |
|---|---|
| host ports | :3000/tcp |
| volume path | /srv/homelab/grafana/data |
| RAM | 260 MB |
| CPU share | 0.30 vCPU (cpus: "0.30") |
| update cadence | quarterly, pinned tag. Dashboards are versioned in the database, so an upgrade that changes a panel type can be seen and reverted |
| arm64 | arm64 native; the image has no compiled plugins in this configuration, which keeps it small |
| host | container | proto | exposed | used for |
|---|---|---|---|---|
| :3000 | 3000 | tcp | LAN only | dashboards over the metrics the Prometheus node collects |
Deployment steps
Create the data directory and generate the admin password
Generate the password into the env file rather than typing it into the login form, because the image only prompts for a change after the panel is already reachable.
run sudo mkdir -p /srv/homelab/grafana/data sudo chown -R 472:472 /srv/homelab/grafana echo "GRAFANA_PASSWORD=$(openssl rand -base64 24 | tr -d '/+=')" >> /srv/homelab/.envProvision the data source from a file, not from the interface
A data source clicked into place disappears with the volume. The file makes a rebuild a non-event, and it also means the URL is reviewable in git.
run mkdir -p /srv/homelab/grafana/provisioning/datasources # write prom.yml as shown above, then: cd /srv/homelab/grafana && docker compose up -dImport the three dashboards and export them straight back out
Build them in the UI, then export to JSON in the same session. A dashboard that has never been exported is one volume failure away from being rebuilt from memory.
run # Dashboard -> Share -> Export -> Save to file mkdir -p /srv/homelab/grafana/dashboards && cp ~/Downloads/*.json /srv/homelab/grafana/dashboards/ cd /srv/git/rack-config && git add dashboards && git commit -m 'grafana dashboards'
Three dashboards, and no more
The temptation with Grafana is to build twelve dashboards and look at none of them. Three is the number that survives contact with a household: one for the host (CPU per core, memory, disk, temperature, throttling flags), one for containers (RAM and CPU per container, restart counts, and the ones that have been quietly restarting every hour), and one for the network and storage side (interface throughput, SMART attributes of the SSD, backup job results).
The temperature panel is the one that earns its place daily. A Pi under a passive case in a warm room starts throttling at 80 degrees, and the first symptom is Jellyfin dropping frames — a symptom people chase through the wrong stack entirely.
Provisioning beats clicking
Dashboards built by clicking are lost when the volume is lost, and nobody remembers what a panel was for six months later. Grafana reads data sources and dashboards from files at boot, so they can live in git with everything else.
The datasource file is nine lines and it makes a rebuild of this container a non-event.
# /srv/homelab/grafana/provisioning/datasources/prom.yml
apiVersion: 1
datasources:
  - name: prometheus
    type: prometheus
    access: proxy
    url: http://prometheus:9090
    isDefault: true
    editable: false
What Grafana is not for here
Grafana is not the alerting path on this rack. Alerts go through Uptime Kuma for up-or-down and through Prometheus alert rules for slow burns; Grafana is where you look when you already know something is wrong. Nobody in the house is going to open a dashboard because of a notification — that is what the status page is for.
compose file
Drop the whole file at /srv/homelab/grafana/compose.yaml. Tags are pinned, never latest: rolling back on a Pi is far more work than upgrading.
services:
  grafana:
    image: grafana/grafana:11.4.0
    container_name: grafana
    restart: unless-stopped
    ports:
      - "3000:3000/tcp"
    environment:
      TZ: Asia/Shanghai
      GF_SECURITY_ADMIN_PASSWORD: ${GRAFANA_PASSWORD}
      GF_USERS_ALLOW_SIGN_UP: "false"
      GF_AUTH_ANONYMOUS_ENABLED: "false"
      GF_ANALYTICS_REPORTING_ENABLED: "false"
    volumes:
      - /srv/homelab/grafana/data:/var/lib/grafana
    networks: [rack]

networks:
  rack:
    external: true
Hardening checklist
- anonymous access is off and the admin password comes from the environment on first boot
- the data source uses a read-only Prometheus user, so a compromised dashboard cannot write metrics
- the panel is behind the proxy's LAN-only rule, never forwarded
- the public dashboards feature is disabled, since there is nothing here to share publicly
Backup plan
the SQLite database in the data volume holds every dashboard, user and data source, and is dumped nightly. Dashboards themselves are also exported as JSON into git after any change, because a dashboard you cannot diff is a dashboard nobody reviews.
Verify it went in clean
- The Prometheus data source tests green from the Grafana UI
- A container restart is visible as a step in the restart-count panel within one scrape interval
- The host dashboard shows a temperature curve with the throttling flag panel on the same row
- Rebuilding the container from the compose file restores the provisioned data source without any clicking
What bit us
- Grafana's default admin password is admin/admin and it only prompts for a change when you log in. Setting it through GF_SECURITY_ADMIN_PASSWORD before the first start avoids a window where the panel is wide open.
- An anonymous-access setting left on for a quick share is the most common way a home Grafana ends up public. Turn it off after the demo, not before the demo.
- Dashboards stored only in the volume are gone the day the volume is gone, which is exactly the day you need them to remember what the baseline looked like.
Hardware questions
- Do I need Grafana if I already have Uptime Kuma?
- They answer different questions. Uptime Kuma says a service is down and pages you; Grafana shows that the memory of that service has crept up 40 MB a week for three months, which is why it died. If you only have four services, Uptime Kuma alone is honest and sufficient. Past ten, the trend view starts paying for itself.
- How much does the whole monitoring stack cost on a Pi?
- Grafana 260 MB, Prometheus 700 MB with a fifteen-day retention, the node exporter 30 MB, Uptime Kuma 180 MB. Around 1.2 GB total, which on an 8 GB board is affordable and on a 2 GB board is not.
- Can Grafana run off the NAS instead?
- It can, and if you already run a NAS with container support, that is where the metrics stack belongs — Grafana and Prometheus are the least latency-sensitive services on this list, and the NAS usually has the disk for long retention. This rack keeps them on the Pi because the NAS is a backup target.